The MACD indicator is probably the most popular trading indicator there is. It is found on almost every stock chart, its shows by default if you pull up a stock on www.stockcharts.com. So can you use the MACD as a trading strategy?
Before going into how to use it properly, let’s go over what it actually is. The MACD indicator measures momentum by measuring the distance between two different moving averages and plotting a line as the average.
This where its name comes from, MACD = Moving Average Convergence Divergence. It was originally developed in the late 70’s years by Gerald Appel.
He first discussed the MACD in his book Technical Analysis Power Tools for Active Investors, and to this day remains the most popular swing trading indicator.
Overview Of The MACD Indicator
When a beginner trader first look at the MACD it can look a bit complicated and intimidating. However, once you understand what you are looking at, it’s actusally quite simple.
The MACD just takes two moving averages (default settings are the 26 day EMA and the 12 day EMA) and subtracts the longer period MA from the shorter period EMA creating the “MACD line” and plotting it on the chart.
Then a 9 period average of this line is created and plotted on the chart as well.
This line is called the “signal line” and it tell us the whether momentum of the stock is increasing or decreasing.
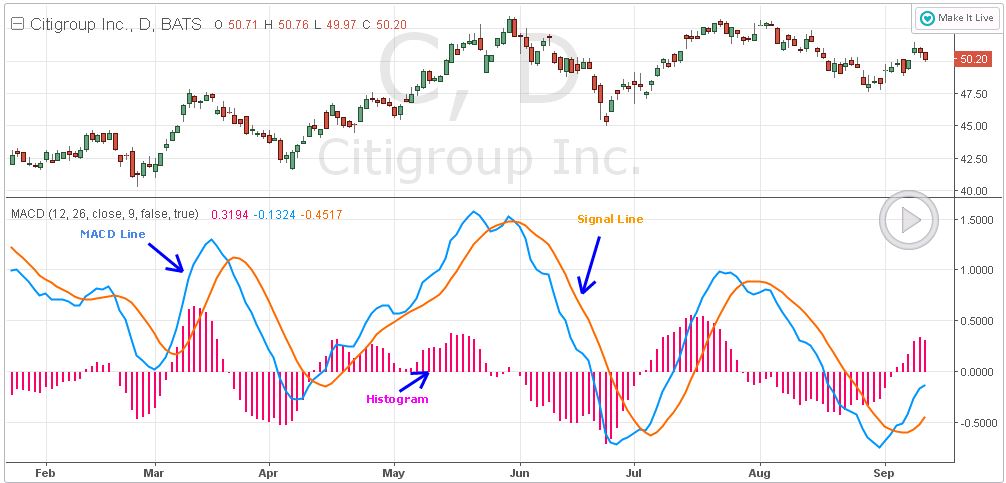
The Three Major Components Of The MACD
The MACD Line
MACD Line is a result of taking a longer term EMA and subtracting it from a shorter term EMA. The most commonly used values are 26 days for the longer term EMA and 12 days for the shorter term EMA, but it is the trader’s choice.
The Signal Line
The Signal Line is a 9 period EMA of the MACD Line. The swing trader can choose what period length EMA to use for the Signal Line, 9 is the default setting and the most common.
The MACD Histogram
As time progresses, the difference between the MACD Line and Signal Line will be constantly changing. The MACD histogram takes the difference between the two and creates an easily readable form of it, the histogram.
Think of it as simply as a visual representation of the difference between the MACD Line and the Signal Line.
The farther apart these two lines are, the longer the bar on the histogram is going to be. It will tell us whether the stocks momentum is accelerating or decelerating.
This is crucial to us swing traders as we only want to jump into a trade when the stock is gaining momentum up or down. A stock that is not moving does nothing for us and just ties up capital.
A Few Example Scenarios
- If there is no difference between MACD line and the Signal line then the MACD is at or near the zero line, this tells the trader the stock is not moving up or down.
- When the 12 period EMA is above the 26 period EMA, the MACD line will move above the zero line. At this point the stock will have positive momentum and be moving up. You should only consider going long or buying the stock at this point.
- This is the opposite scenario, the 12 period 12 is below the 26 period EMA, the MACD line will move below the zero line. At this point the stock will have negative momentum and moving down. At this point only shorts should be considered or on the sidelines.
When the MACD histogram is below the Zero Line, then the MACD is considered negative and conversely when the MACD histogram is above the Zero Line we can say the MACD is considered positive.
MACD Trading Strategies
The simplest MACD trading strategy is the Signal Line Crossover. This is the most basic MACD trading method. The crossover method works well with volatile markets that trend well such as tech stocks and the 2x and 3x ETF’s.
As we already learned, the Signal Line is just a 9 period EMA of the MACD Line. Since the signal line is an average of the MACD line, it lags behind the MACD line. A bullish crossover occurs when the MACD line turns up and crosses above the signal line.
A bearish crossover occurs when the MACD turns down and crosses below the signal line. Once the crossover occurs, you want to make sure both lines gain as much distance apart from each other as possible. This is a good sign that momentum is continuing in the desired direction.

MACD Chart Divergence Swing Trading
Using the MACD and using it by by looking for divergence between the the indicator and price action of the stock. In my opinion this is the BEST way to use the MACD. Essentially what it mean is the MACD is not confirming price action of the stock.
Bearish Divergence
Bearish Divergence occurs when a stock is making higher highs and MACD Line is not confirming price action is making lower lows. It tends to work best after a stock has been up trending strongly for an extended amount of time.
Note: DO NOT try and use divergence trading in a range bound stock. Without strong momentum it wont give you good signals.
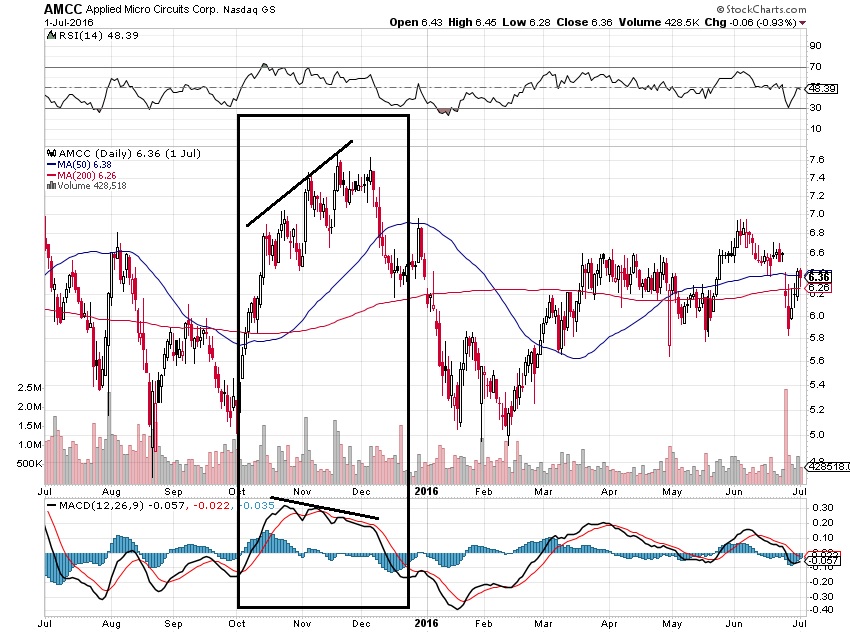
In this example we can see AMCC was making new highs Oct through Dec but notice how the MACD signal line was making lower lows.
This is classic bearish divergence and look at what happened to the stock shortly after. Dropped over 30%, this would have been a great short.
Bullish Divergence
So lets say XYZ stock is trending down and makes a series of lower lows. BUT the MACD is not confirming the lower prices. This sets up a MACD divergence swing trade.
MACD divergence happens when the MACD does not confirm the price of the underlying stock. A bullish divergence occurs when a stock makes a lower low
BUT the MACD forms a higher low. This is a good indicator that selling has run its course and the stock may be ready to turn higher.
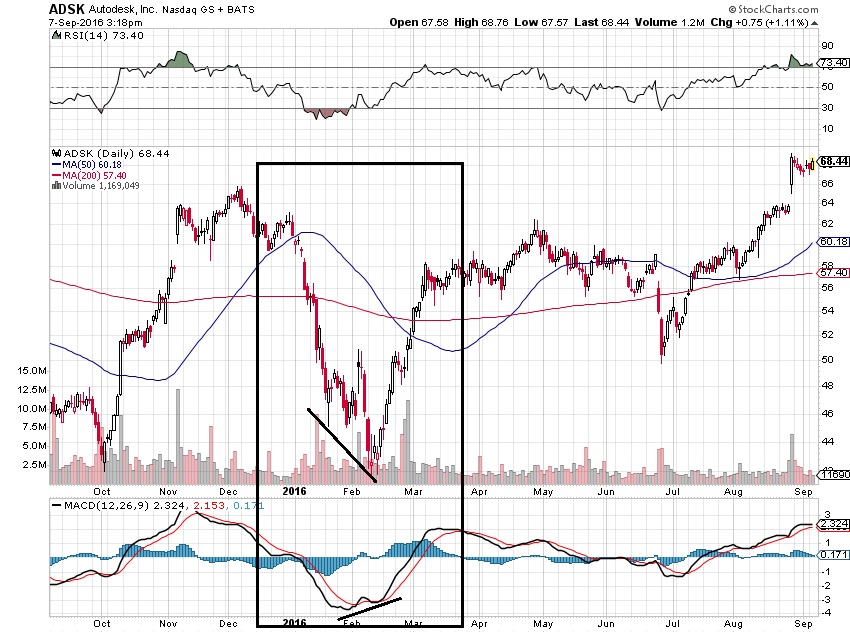
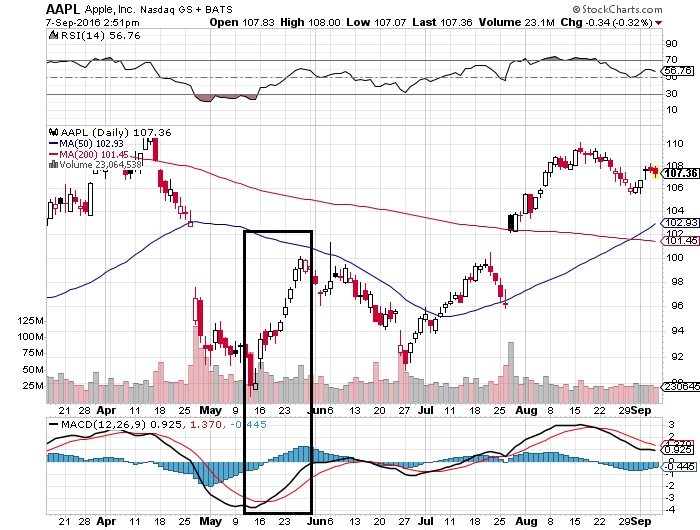
You can see a perfect example with ADSK in the highlighted area. In Feb price made a new low BUT the MACD signal line actually made a higher high and then formed a bullish crossover. This would have been a great opportunity to get long this stock!
Another Example
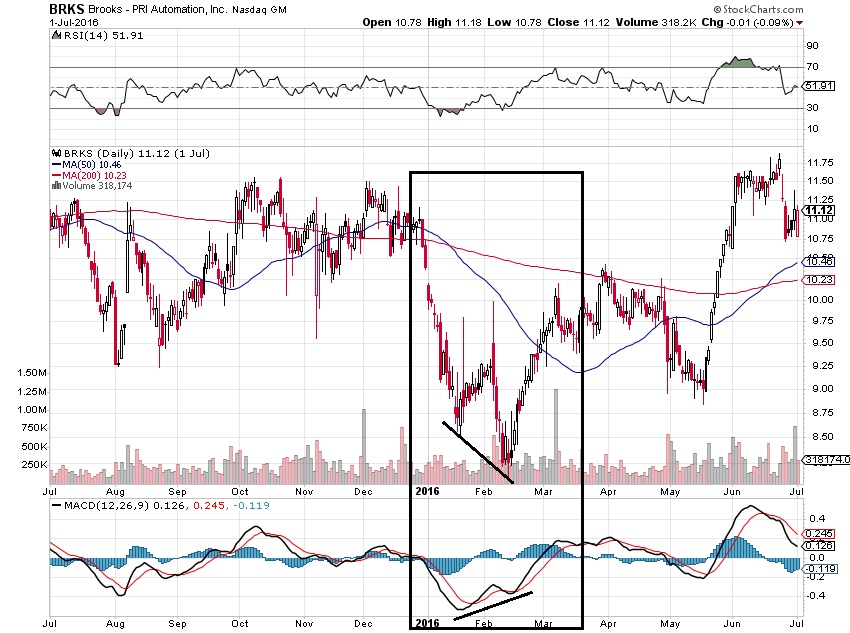
I want to give you one more example of a bullish divergence so you can see how well it works. Notice how BRKS was making new lows in Jan and Feb while the MACD signal line was making higher highs and the MACD histogram was also trending up.
Things To Keep In Mind
There are two main methods for swing trading the MACD, the crossover and divergence. You will find MANY more trading opportunities if you look for crossovers vs divergence. only use a MACD crossover trading in the direction of the trend.
You will have MUCH better success using it to trade with the trend than trying to pick tops and bottoms.
Using the divergence swing trading method. You be using it to pick tops and bottoms so here you want to see a long term trend where the buying and selling has exhausted itself and ready to make a reversal.
Just be sure to put a stop in below the low to protect yourself in case your wrong.
This is one of the strategies that all successful stock picking services use like Jason Bond and Microcap Millionaires. I would recommend using a swing trading service at least until you can pick stocks reliably on your own.
Here are the two stock picking services I use for almost all of my trades: Microcap Millionaires and Jason Bond Picks
You can read my reviews here: Microcap Millionaires Review and Jason Bond Picks Review
If Penny Stocks are your thing, then you should definitely check out Microcap Millionaires.
Read my review of Microcap Millionaires
You can read all my reviews on stock picking services here:
If you are looking to open a brokerage account or looking for a better one, I wrote some reviews of brokers I have used and currently using.
OptionsHouse Review (Currently Using)
Scottrade Review (Used when I first started)
If you have any questions feel free to contact me.
– Robert Walsh